

Free NILnomics Research
Two Front Doors
Every Power 4 athletic department runs two social media brands. One is roughly twice the size of the other, and the department budget is divided as though the opposite were true.
Watch the Discussion
Go Inside the Data Behind “Two Front Doors”
Kyle Ems is joined by Greg Chick of NILnomics and Brent Wall of Student Athlete Score for a deeper discussion of the data, findings and implications behind Two Front Doors.
If you're on any social media platform, it's likely you see your favorite Power 4 team's presence in some form. These schools have massive online platforms that operate as a type of top of funnel customer acquisition through extensive content generation. What's always interested me is how athletic departments run so many different accounts not only across all the social media platforms, but across different teams.
Every P4 athletic department maintains a general athletics account and a separate football account. In practice these are two distinct properties reaching two distinct audiences, and departments rarely evaluate them as such. The general account carries the institutional identity across every sport. The football account carries one team.
About the Data
Student Athlete Score × NILnomics
This analysis pairs social-media performance data from Student Athlete Score with FY2025 institutional athletics financial filings collected and analyzed by Greg Chick.
The following analysis pairs two datasets. The first is from Student Athlete Score. They built one of the first platforms tracking NIL and social media performance across college athletics — brand deals, follower growth, engagement, and audience demographics, down to the individual player. Multimedia rights holders and scouting organizations already use it to evaluate athlete value. They gave me database access and walked me through the tooling. Their dataset covers 65 P4 schools active in its database — 130 accounts in total, one general athletics account and one football account per school, tracked across Instagram, TikTok, and X. It records current followers, followers twelve months prior, and impressions, engagements, posts, and engagement rate over the trailing year.
The second is institutional athletics financial filings for FY2025, covering total department operating budget and football-specific spending at 47 of those schools. This was retrieved by me through public records requests, document scraping, and data cleaning.
The timing of that pairing is worth stating up front. FY2025 closed in mid-2025. The social measurement window opens in August 2025 and closes in August 2026. The budget therefore precedes the outcomes it is matched against. That ordering does not make anything below causal, but it does rule out the most obvious form of reverse causation, and it makes the questions sharper than a same-period comparison would.
Four questions organize what follows. 1) How large is the gap between a department's football audience and its institutional audience? 2) Which side is growing, and why? 3) What does FY2025 spending actually predict about the attention a program commands? 4) And how does the distribution of money compare to the distribution of attention?
1) The size of the gap
Across P4, the 130 tracked accounts hold 82.6 million followers. Football accounts hold 55.5 million of that, or 67.2 percent. General athletics accounts hold the remaining 27.1 million. In aggregate, football is 2.05 times the size of the department brand it sits inside.
At the median school the football account is 1.94 times the size of the main athletics account.

The extremes tell the story here. LSU's football account is 7.32 times the size of its department account — 2.69 million followers against 367,000. Clemson runs 5.00 times, Tennessee 4.74, Duke 4.43. In each case the football program functions as the institution's primary public channel by a wide margin and the department account operates as a secondary property.
Five schools invert the pattern. Louisville's main account is 1.6 times its football account, USC's 1.5 times, and Arizona, Kansas, and Oregon sit at or near parity.
The relationship between the two accounts is systematic rather than idiosyncratic. Regressing log main-account followers on log football followers gives a slope of 0.745 with an R² of 0.585: the two scale together, but not proportionally. As a program grows, its football account grows faster than its department account, and the tilt increases with institutional scale.

Conference patterns follow the expected order. SEC football accounts hold 72 percent of that conference's tracked following, with a median school ratio of 2.56. The ACC follows at 68 percent, then the Big 12 at 64 and the Big Ten at 62. The Big Ten is the largest conference in the sample by total following and also the most balanced; Ohio State, Oregon, Michigan, and USC all operate department accounts above 550,000 followers.
The second panel above introduces a pattern that recurs throughout this analysis. Football's dominance is not uniform across metrics. In the median department, football supplies 67 percent of impressions, 66 percent of followers, and only 60 percent of engagements. Its advantage is largest at the top of the funnel and narrows as the ask gets larger.
2) Reach and response are different assets
Follower counts describe potential audience. The trailing-twelve-month engagement data describes what each account does with it, and it reverses the ranking.
Main athletics accounts post more. The median general account published 1,811 posts over the year against 1,602 for the median football account, with the main account posting more at 36 of 65 schools. Football accounts nonetheless generated 1.98 times the impressions per post — 86,701 against 43,751 — and led on that measure at 59 of 65 schools.
But football converts that reach into response at a lower rate. The median football engagement rate is 4.14 percent against 4.89 percent for main accounts. In 52 of 65 schools the general athletics account posts the higher rate, and the median within-school gap is 0.62 percentage points in the department account's favor.

Normalized by audience, the divergence is specific. Both account types deliver similar impressions per follower over the year — 237 for football, 253 for main. The two are comparably efficient at putting content in front of the people who already follow them. Where they differ is downstream: the median main account earns 12.31 engagements per follower against 9.82 for football, roughly 25 percent more.
Football accounts are acquisition channels. General athletics accounts reach smaller, more committed audiences and get more back from each one.
The operational reading is that these accounts do different jobs. Football accounts are acquisition channels, reaching large and loosely attached audiences — people who follow a team the way they follow a league. General athletics accounts reach smaller, more committed audiences and get more back from each one. A department that evaluates both on follower count is measuring only the half of the funnel football wins.
3) Who is growing, and the mistake in the obvious answer
Over the twelve months to August 2026, the P4 total moved from 78.8 million followers to 82.6 million, a gain of 4.8 percent. Football accounts grew 5.4 percent and general athletics accounts 3.6 percent. Because football starts from a larger base, that modest rate difference produced a much larger share of absolute movement: football captured 2.83 million of the 3.78 million net additions, or 74.8 percent. The football tilt widened at 39 of 65 schools.
Growth is also highly concentrated. The ten fastest-adding accounts absorbed 43.5 percent of all net follower additions across P4.
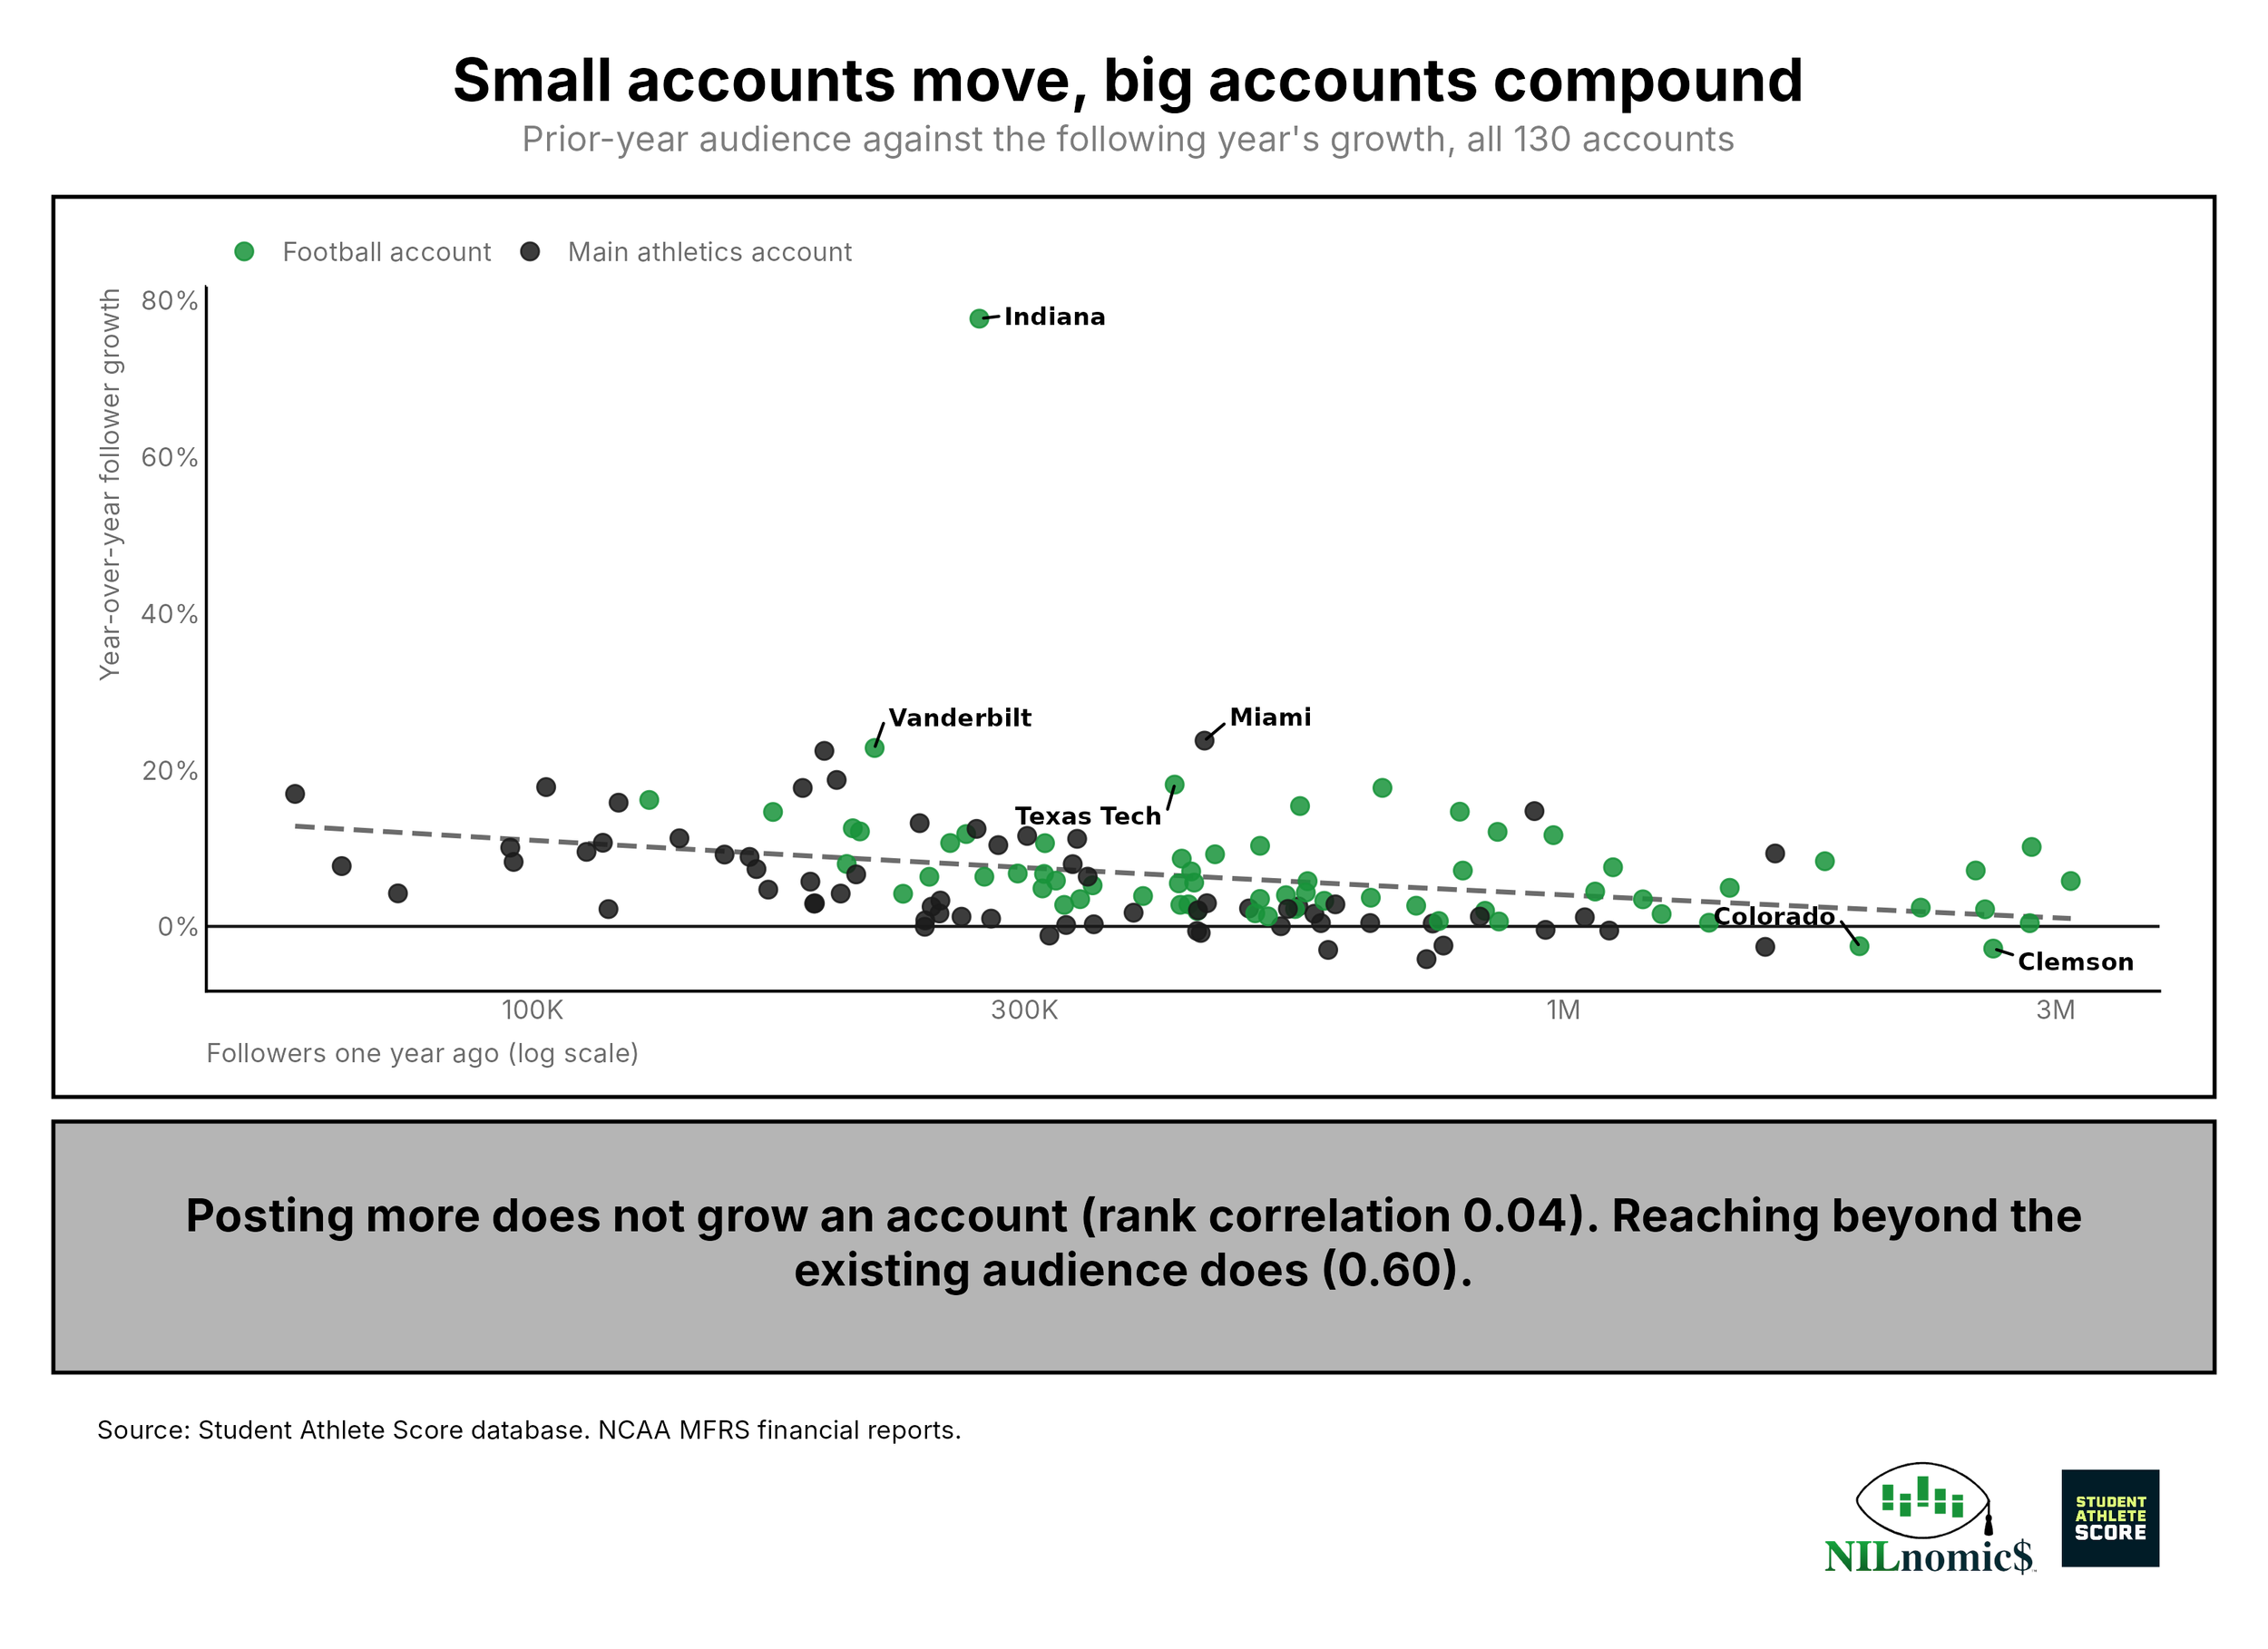
The leaderboard tracks the field closely enough to state plainly. Indiana's football account grew 77.7 percent, adding 210,492 followers — the second-largest absolute gain in the sample, from roughly one-seventh the starting base of the leader. Indiana went 16–0, won the Big Ten and the national championship, and produced the Heisman winner in quarterback Fernando Mendoza. Its general athletics account grew 22.4 percent over the same window. Miami, the national runner-up, posted the largest general-account gain at 23.7 percent. Vanderbilt football grew 22.8 percent behind the program's first ten-win season; Texas Tech football grew 18.1 percent after a program-record twelve wins and a first College Football Playoff appearance.
The decline side is equally legible. Only two football account lost followers: Clemson, down 2.8 percent after a 7–6 season, and Colorado, down 2.5 percent after finishing 3–9 in the first year without Shedeur Sanders and Travis Hunter. Colorado's football account remains the ninth-largest in the sample at 1.89 million followers — evidence of how durable an audience acquired during a hype cycle can be, and of how completely the accumulation can stop.
The other ten declining accounts are all general athletics accounts. Louisville fell 4.2 percent, Kentucky 3.0, Oregon 2.6, Wisconsin 2.5.
The natural conclusion from those two facts — football grows, department accounts shrink — is that athletic departments are worse at social media than their football staffs. That conclusion is wrong, and the data shows exactly why.
The whole gap is platform mix
Across P4, Instagram grew 10.4 percent over the year and TikTok 9.9 percent. X fell 1.9 percent. The dispersion within X is severe: 71 of 130 tracked X profiles lost followers, against 2 of 130 on Instagram.
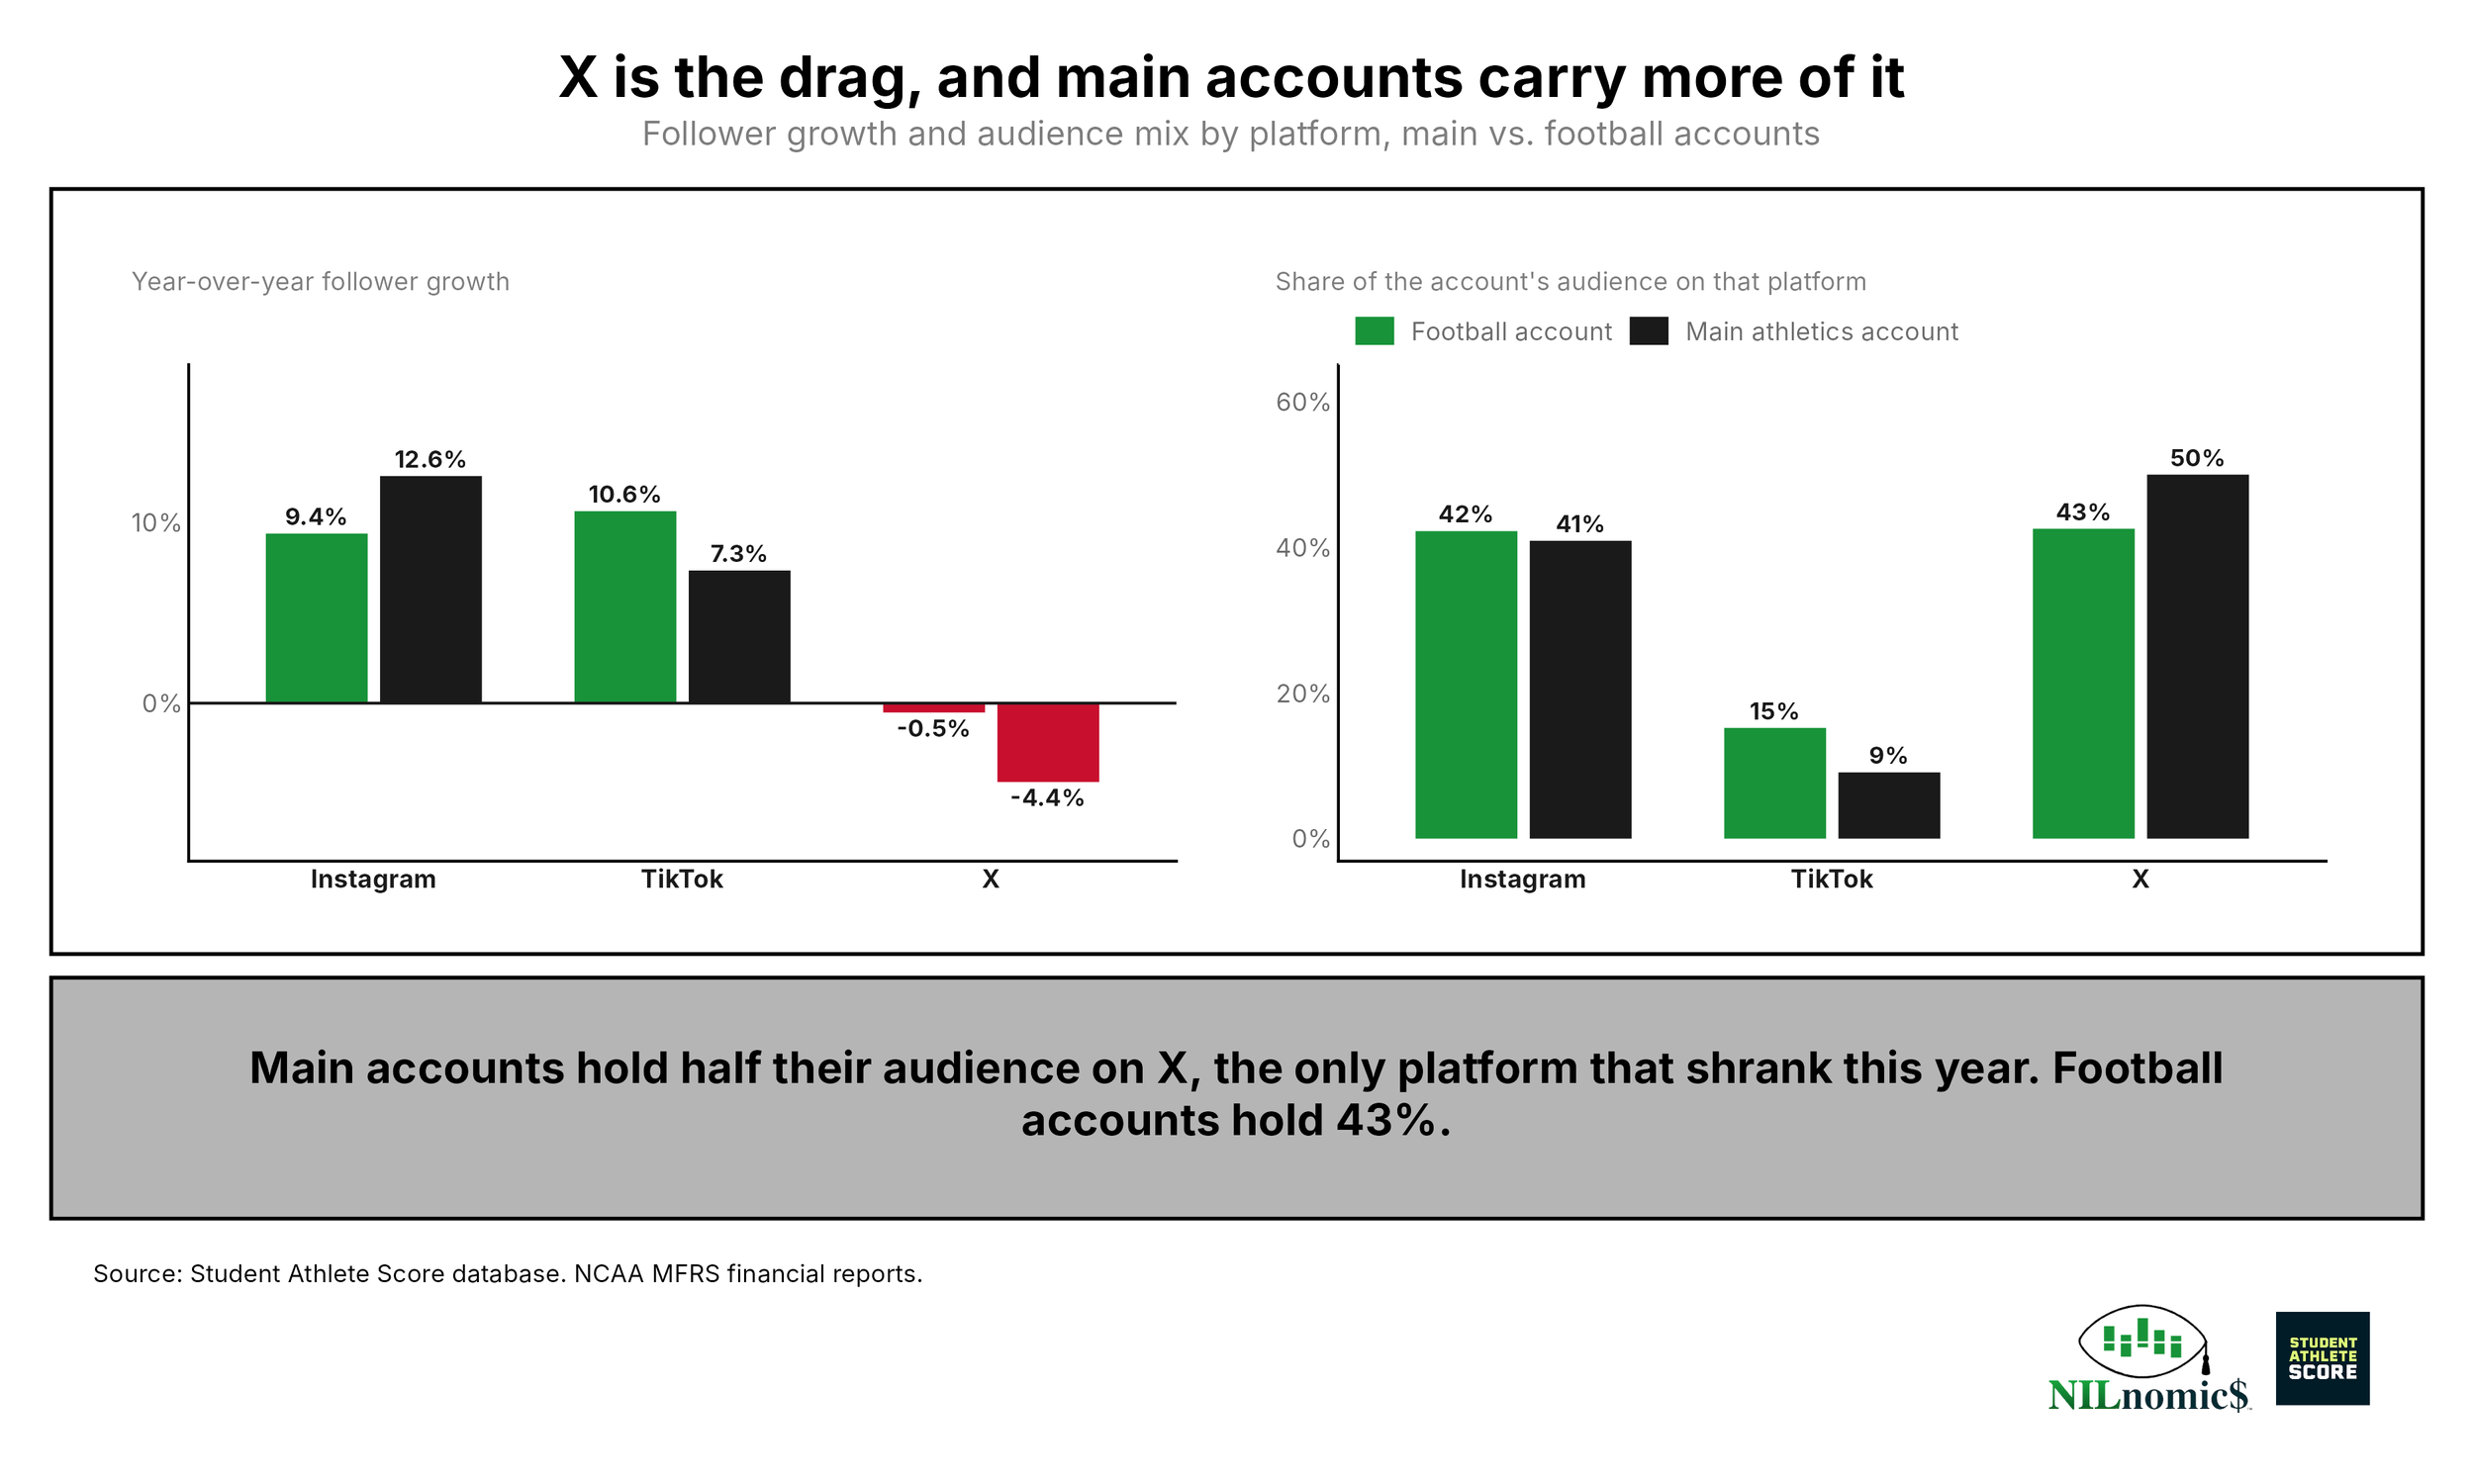
General athletics accounts hold 50 percent of their audience on X. Football accounts hold 42.6 percent. A shift-share decomposition — holding each side's own within-platform growth rates fixed and swapping only the audience weights — attributes the majority of the growth gap to that mix difference alone.
The within-platform rates point the other way entirely. On Instagram, general athletics accounts grew 12.6 percent against football's 9.4 percent. Not one of the 65 main-account Instagram profiles lost followers. Where main accounts lose is X, where they fell 4.4 percent against football's 0.5 percent, with 47 of 65 declining outright.
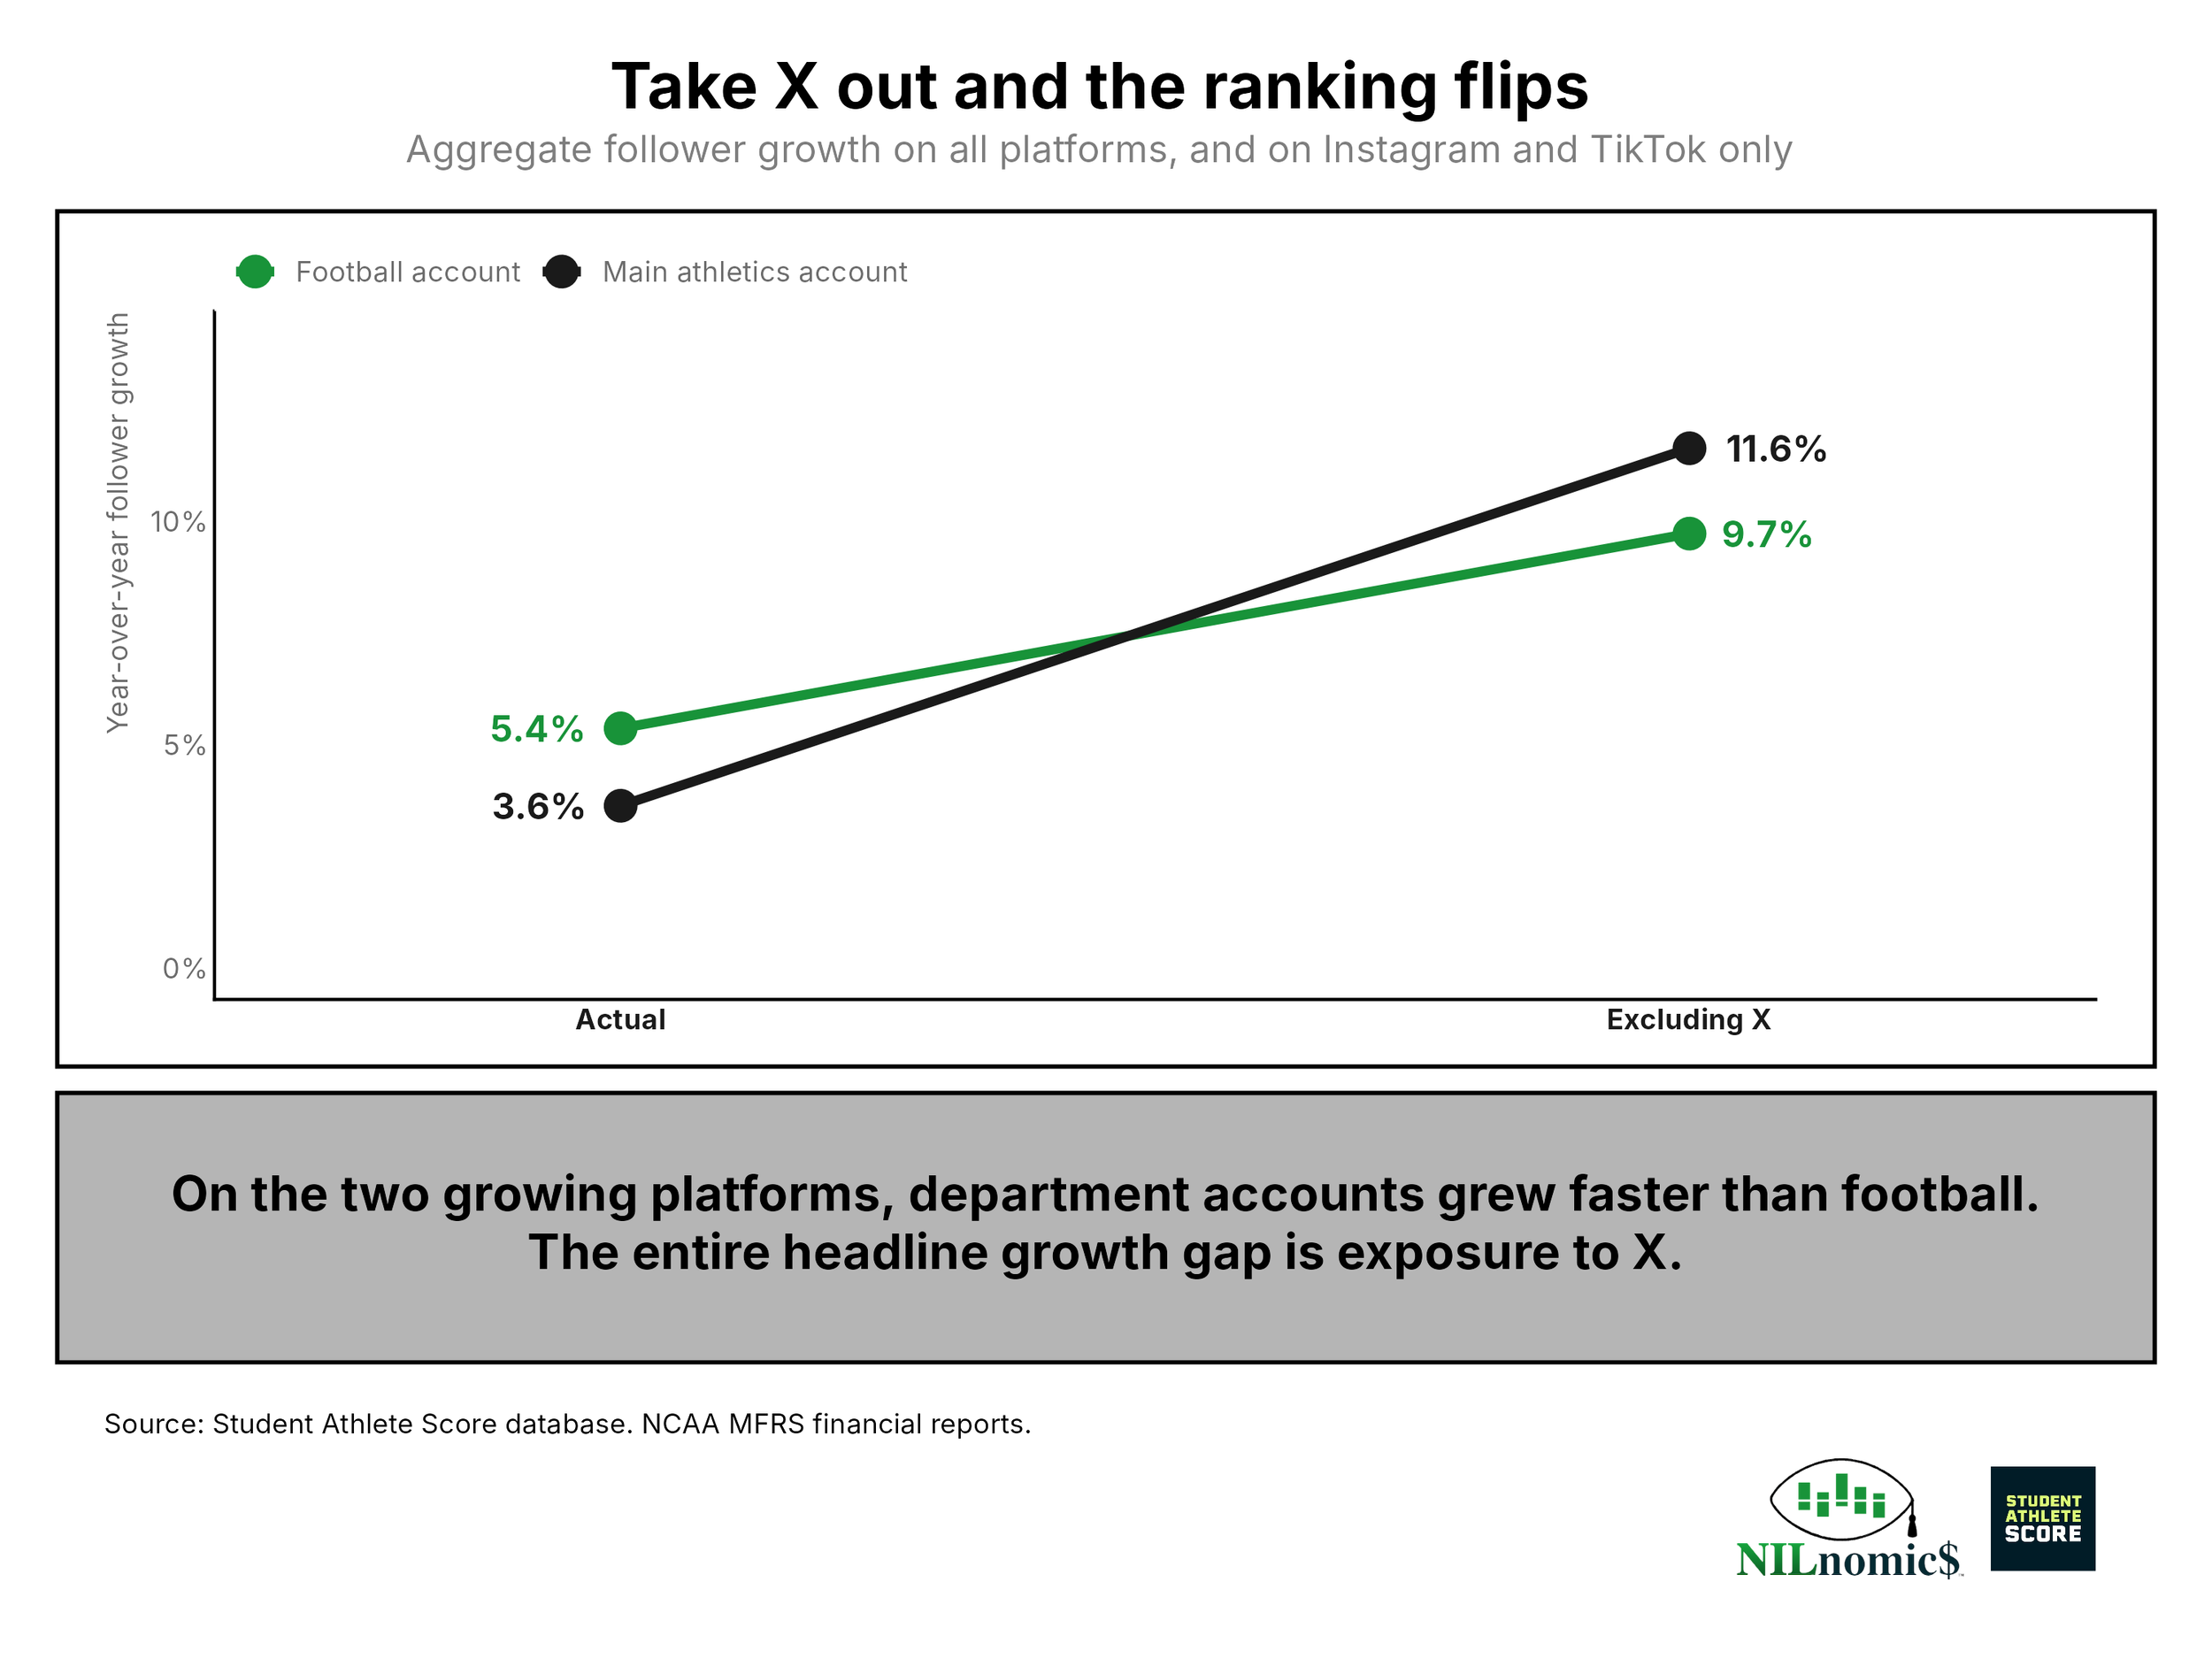
Removing X from the calculation reverses the headline. On the two growing platforms, general athletics accounts grew 11.6 percent and football accounts 9.7 percent. The department brands are not losing the audience competition. They are more heavily invested in the one platform that is contracting, and that exposure is doing all of the work.
TikTok adoption compounds it. Forty-eight of 65 football accounts maintain a tracked TikTok presence; only 23 of 65 general athletics accounts do. TikTok accounts for 15.2 percent of the football audience and 9.1 percent of the department audience.
Two implications follow. First, flat or declining general-account growth is a portfolio problem before it is a content problem, and the diagnostic is one calculation: what share of the audience sits on X. Across all 130 accounts, the rank correlation between X share and growth is −0.24. Second, the 42 departments without a tracked TikTok presence are absent from a channel that grew nearly 10 percent this year, and that absence compounds annually.
Two further correlates are worth a department's attention. Posting volume has essentially no relationship to follower growth — a rank correlation of 0.04 across all 130 accounts. Impressions per follower, which measures how far content travels beyond the existing audience, correlates at 0.60. Growth in this sample is a function of distribution, not output. In a multivariate model including account size, reach per follower, engagement rate, and account type, all four terms are significant and the model explains 36 percent of the variation in growth.
4) What FY2025 spending predicts
Among the 47 schools with FY2025 filings retrieved via public record requests, the median athletic department operated on $175.8 million and the median football program on $50.7 million. Football's share of department spending runs from 19.7 percent at Texas to 43.7 percent at Washington, with a median of 27.0 percent.
Conference differences in level are large: the median SEC department spends $219.6 million against $135.6 million in the Big 12. Differences in allocation are small. Football's median share of the budget is 29.4 percent in the Big Ten, 26.7 in the Big 12, 26.6 in the ACC, and 25.9 in the SEC. Conferences differ in how much they spend, not much in how they divide it.
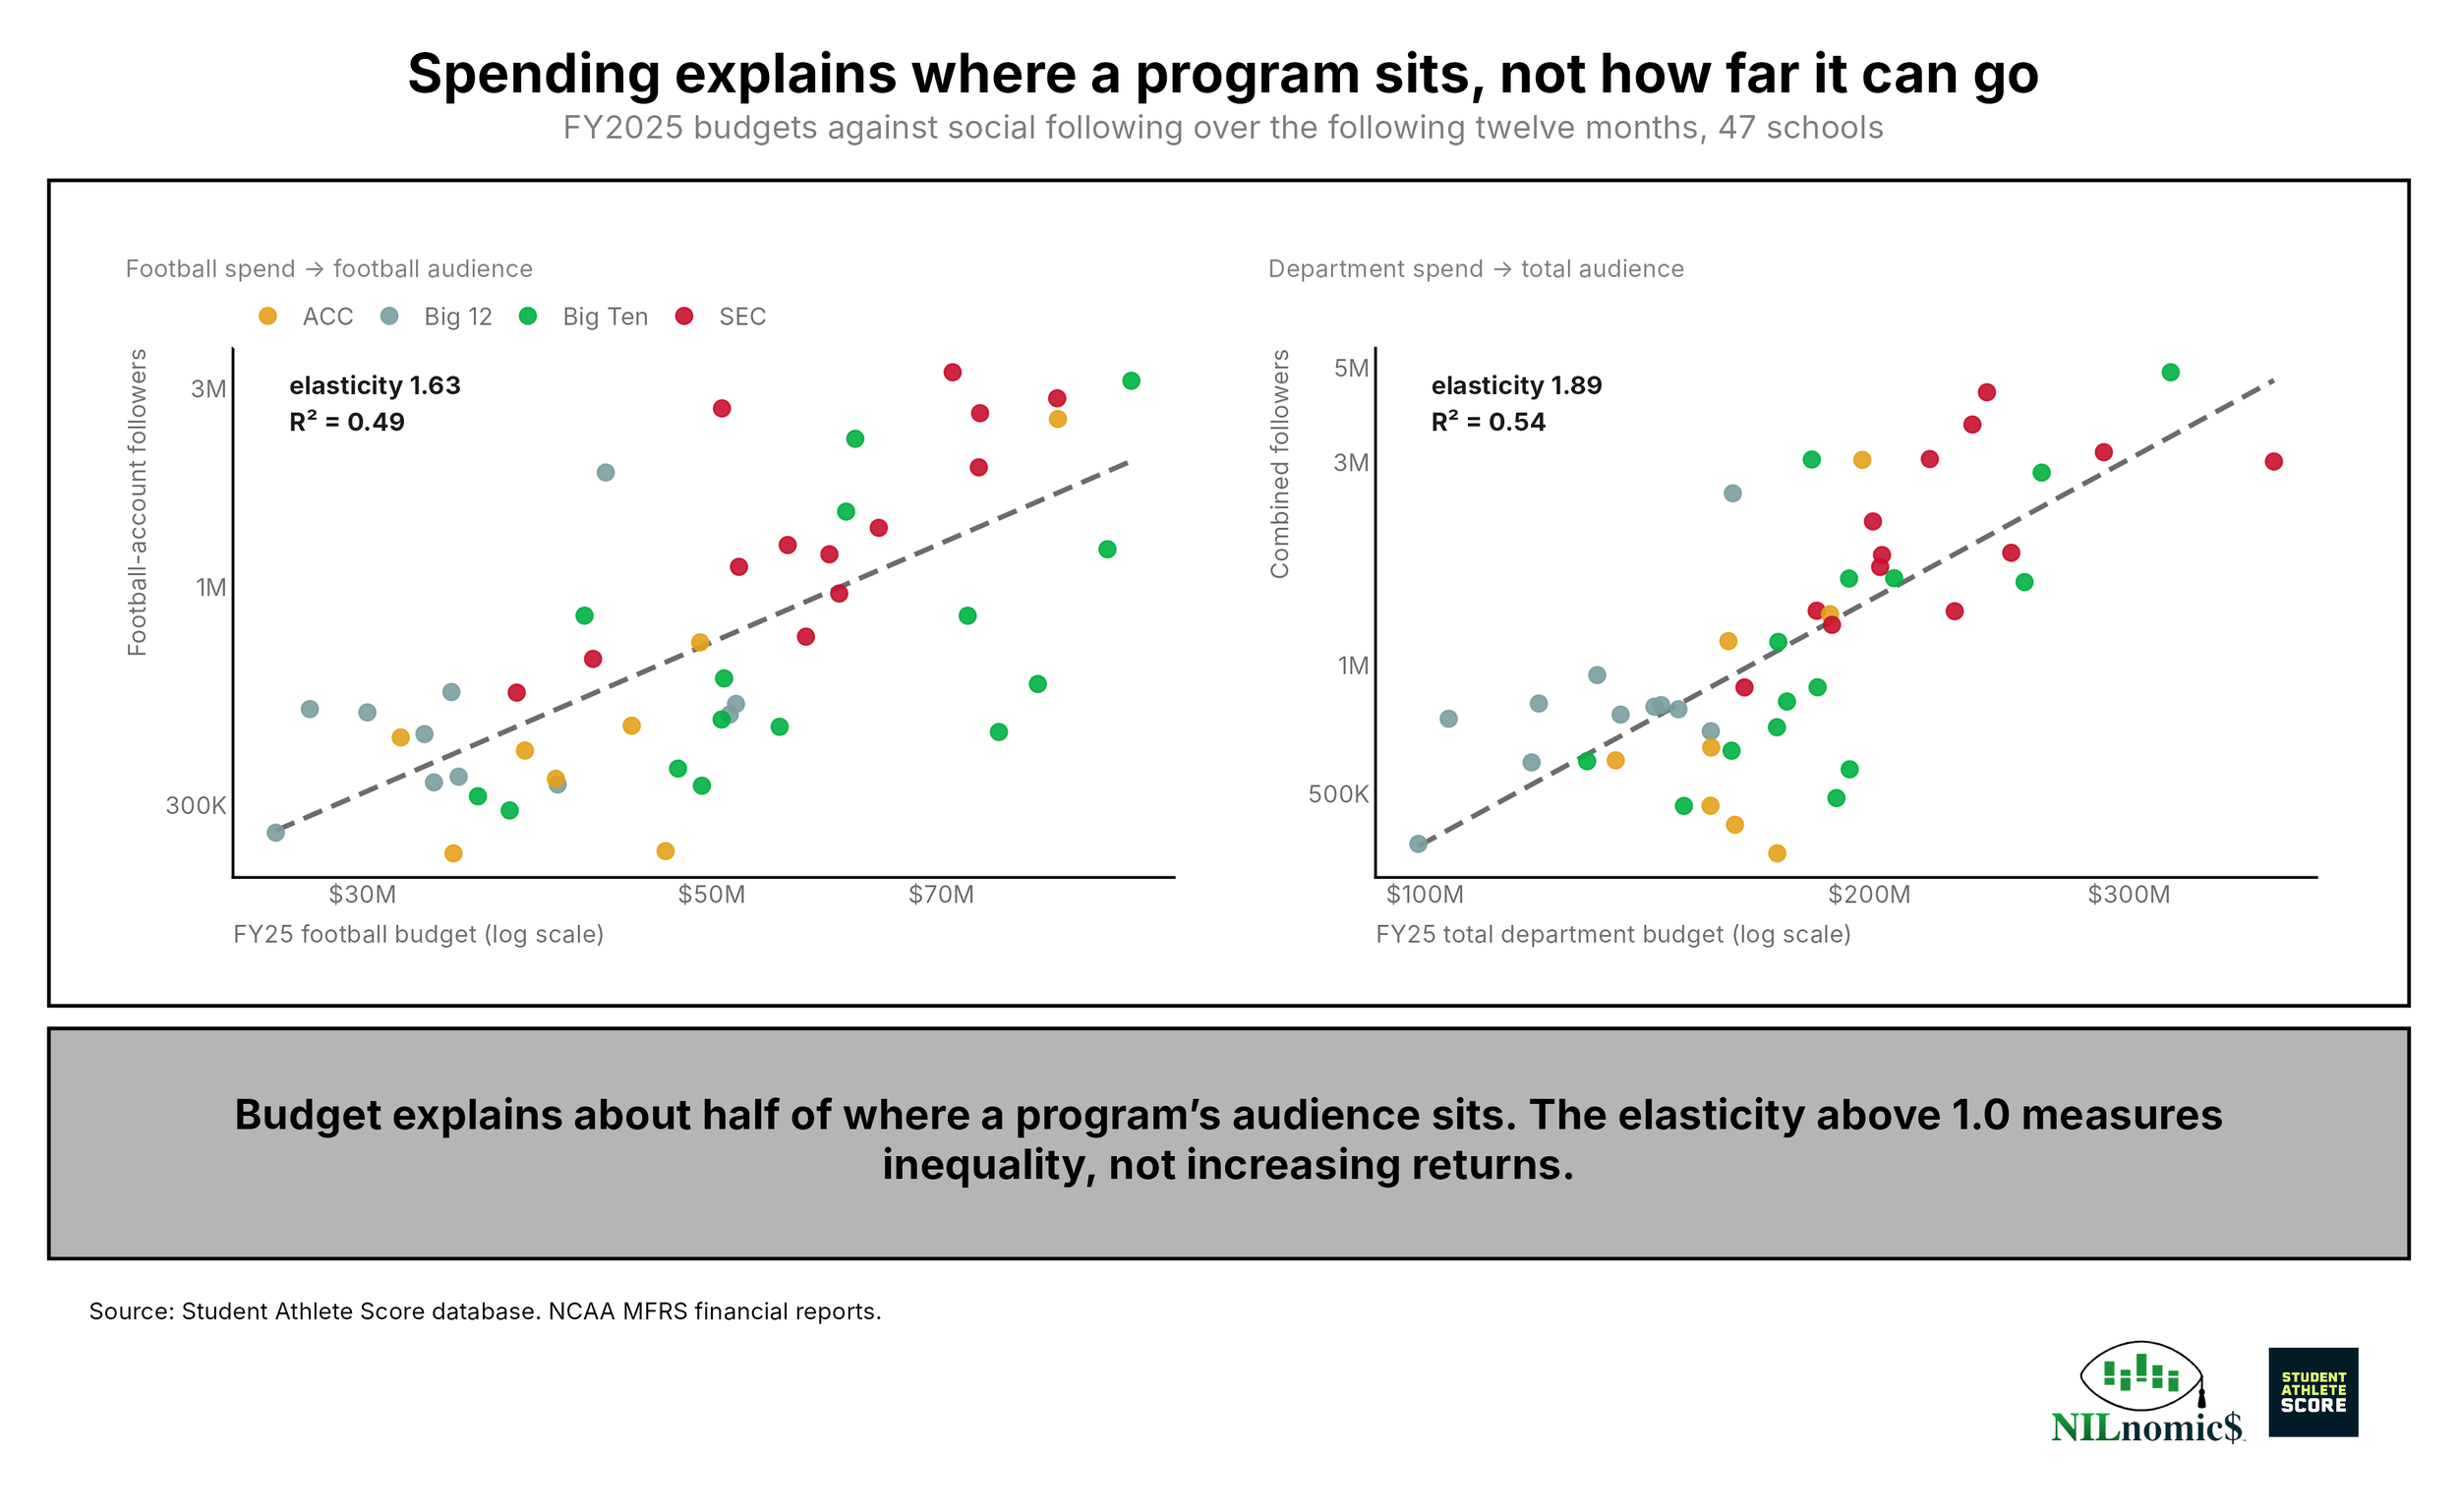
Regressing log following on log spending gives an elasticity of 1.63 for football and 1.89 at the department level, with budget explaining 49 and 54 percent of the variation respectively. Both exceed 1.0, which would ordinarily suggest increasing returns to spending. That reading would be a mistake, and the reason is worth spelling out.
An elasticity is the correlation between two logged variables multiplied by the ratio of their dispersions. Football budgets across these 47 schools span a factor of 2.4 from the tenth to the ninetieth percentile. Football followings span a factor of 7.9. In log terms attention is 2.34 times as dispersed as money. Multiply that ratio by the correlation between the two — 0.70 — and the product is 1.63. The elasticity above 1.0 is a statement about how much more unequally attention is distributed than budget, not about what a marginal dollar produces.
The interpretable quantity is the correlation, and it is moderate. Spending accounts for roughly half the variation in football following and leaves the other half unexplained. One relationship is flatly absent: football budget has no detectable relationship to how much a program posts, with an elasticity of 0.24 and a p-value of 0.22. Money is not buying content volume.
Taken together, these results draw a fairly narrow boundary around what a budget line can be expected to do. FY2025 football spending predicts roughly half of where a program's football audience sits a year later. It does not predict how much that program posts. And the half it does explain is better understood as position than as purchase: budget, conference affiliation, and accumulated on-field results all move together, and a cross-sectional regression cannot separate them. A meaningful part of the above-one elasticity traces to the SEC alone — excluding those thirteen programs takes it from 1.63 to 1.27.
The more useful number is the half left over. Fifty-one percent of the variation in football following sits outside the spending relationship entirely, and the programs inside that residual range from 3.6 times the audience their budget predicts down to less than a third of it. That dispersion is not noise to be apologized for. It is the portion of the relationship a department has any real prospect of influencing, and it is worth looking at directly.
The efficiency spread
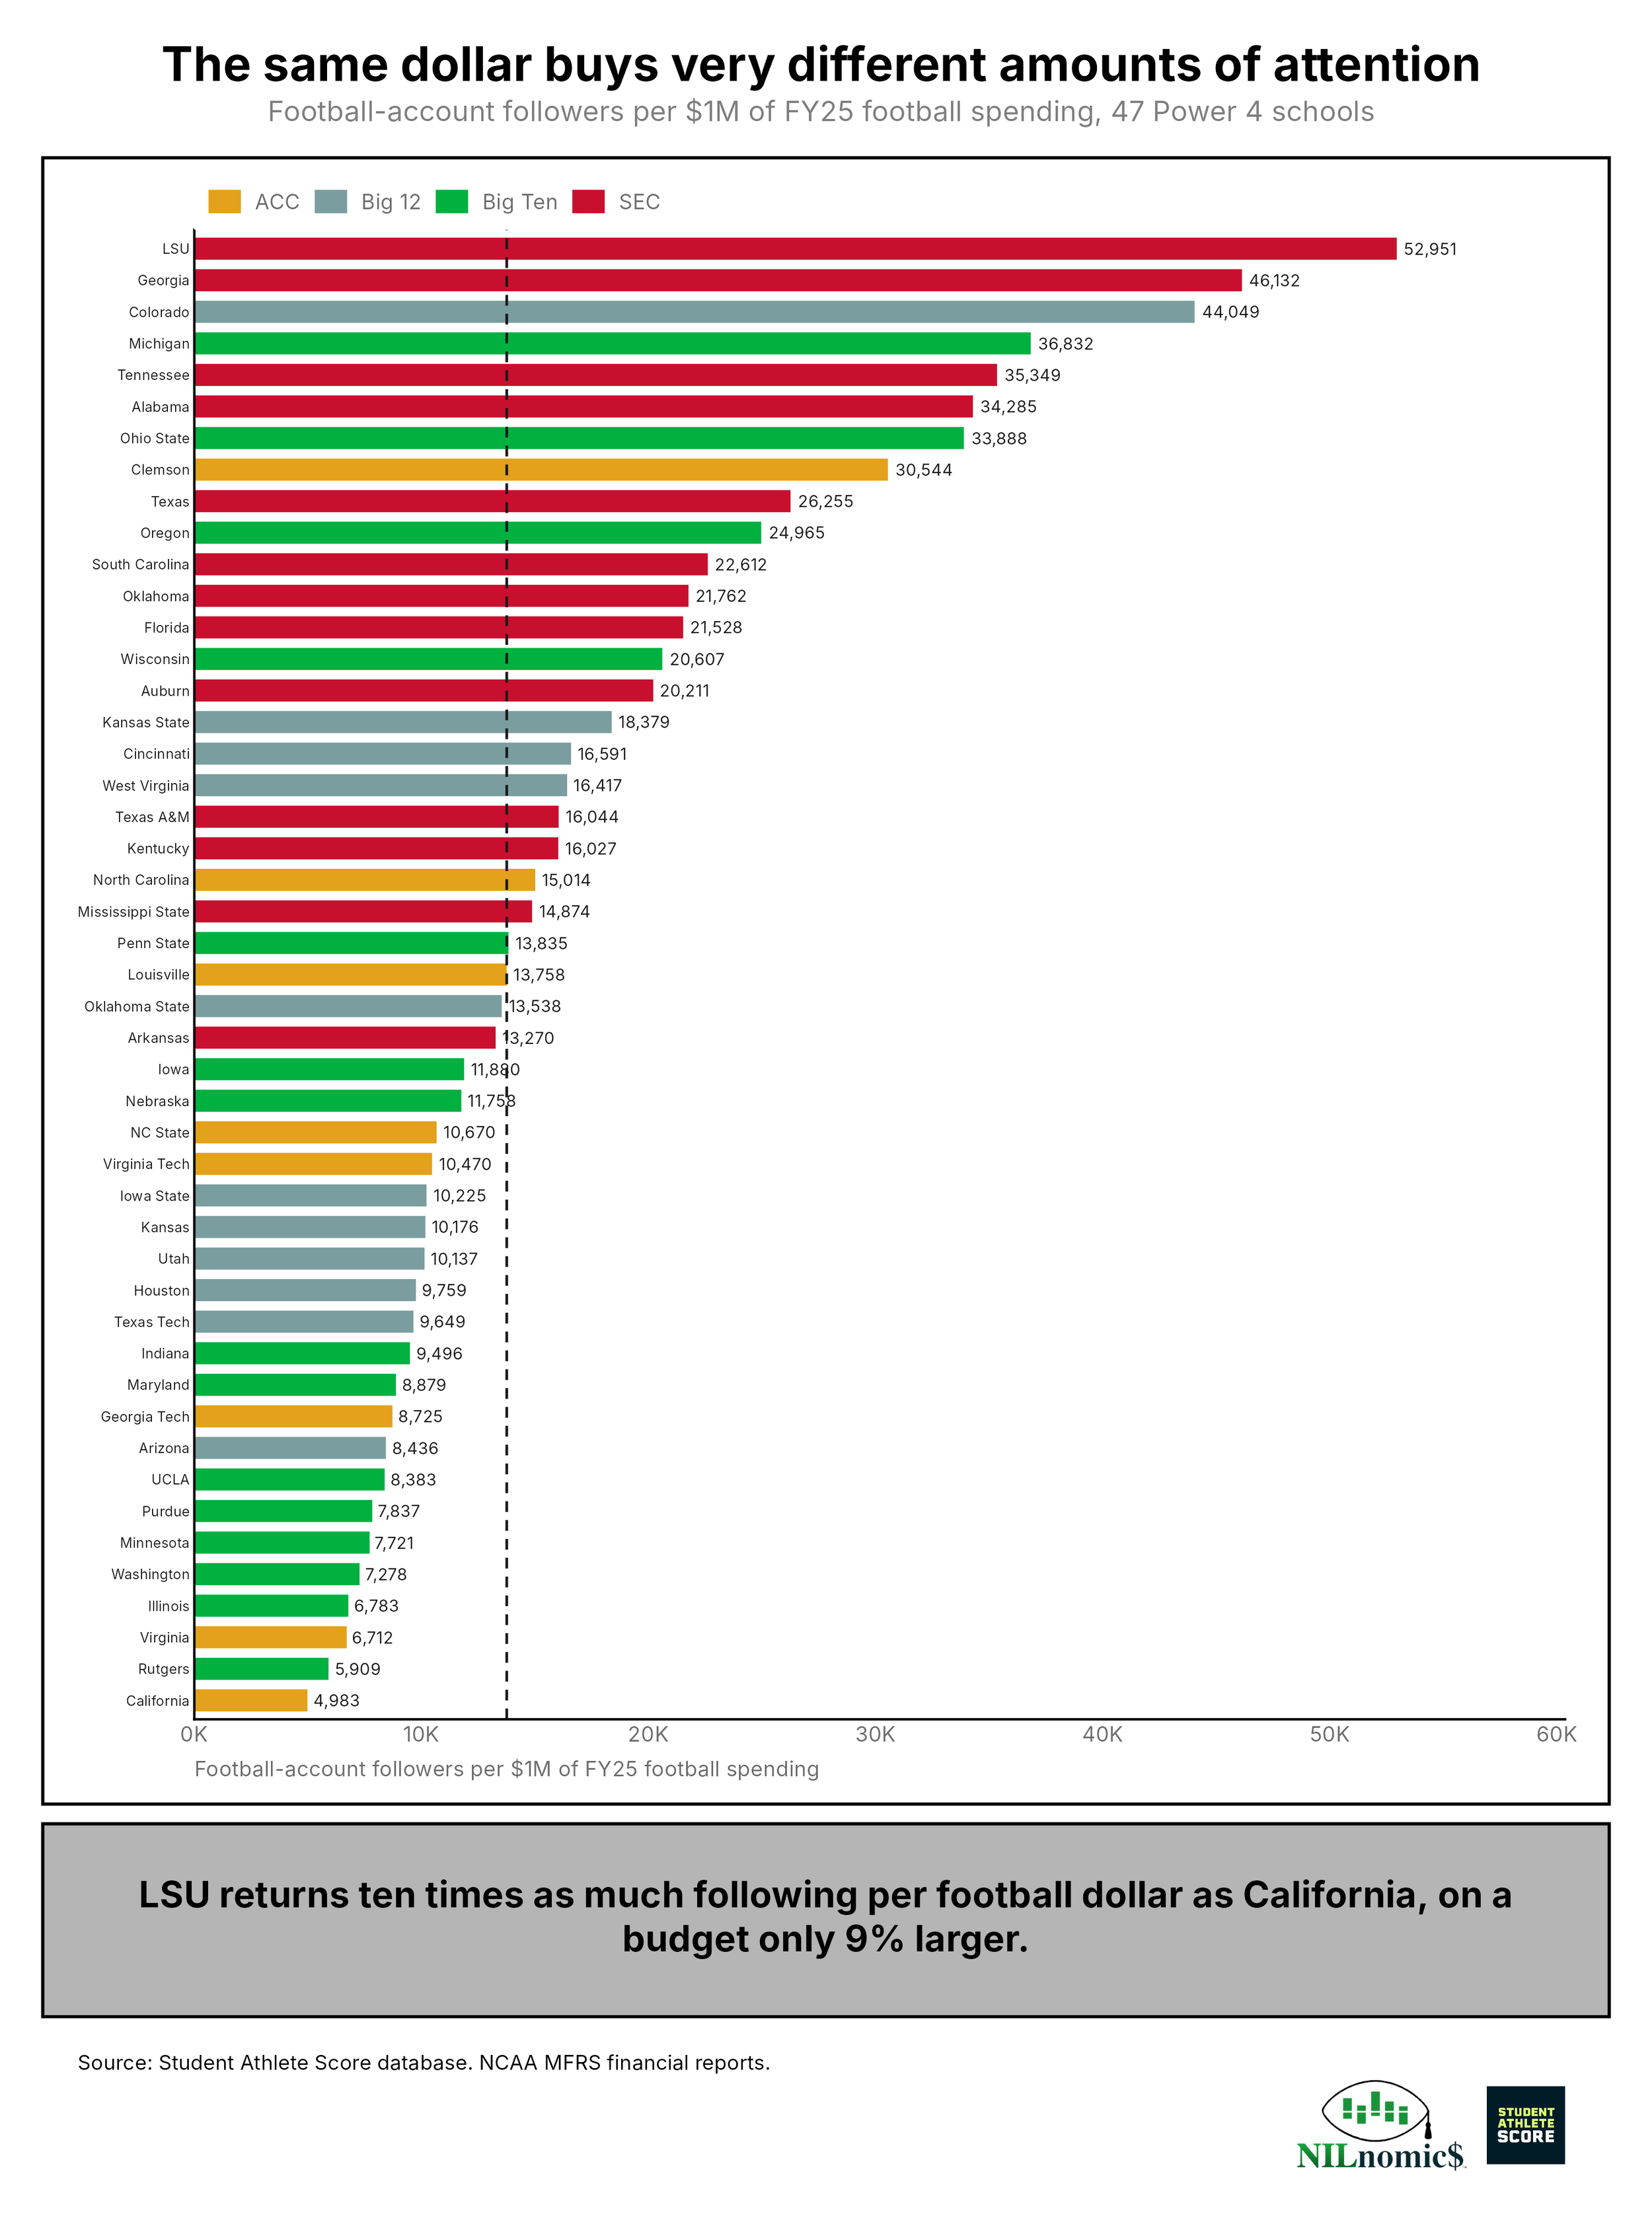
The median program returns 13,758 football followers per $1 million of football spending. LSU returns 52,951; California returns 4,983 on a budget 8 percent smaller. That is a tenfold spread among programs whose budgets differ by less than a factor of two.
A department can also express the same relationship in media terms. Treating the entire football budget as though it purchased attention, the median program spends $334 per thousand football-account impressions and $7.91 per engagement. At the department level it is $694 and $15.20.
These are whole-program costs divided by social output, not media rates. A football budget buys a football team; the impressions are a byproduct. The absolute figures should not be read as what attention costs. The comparison across conferences is the part that carries information.
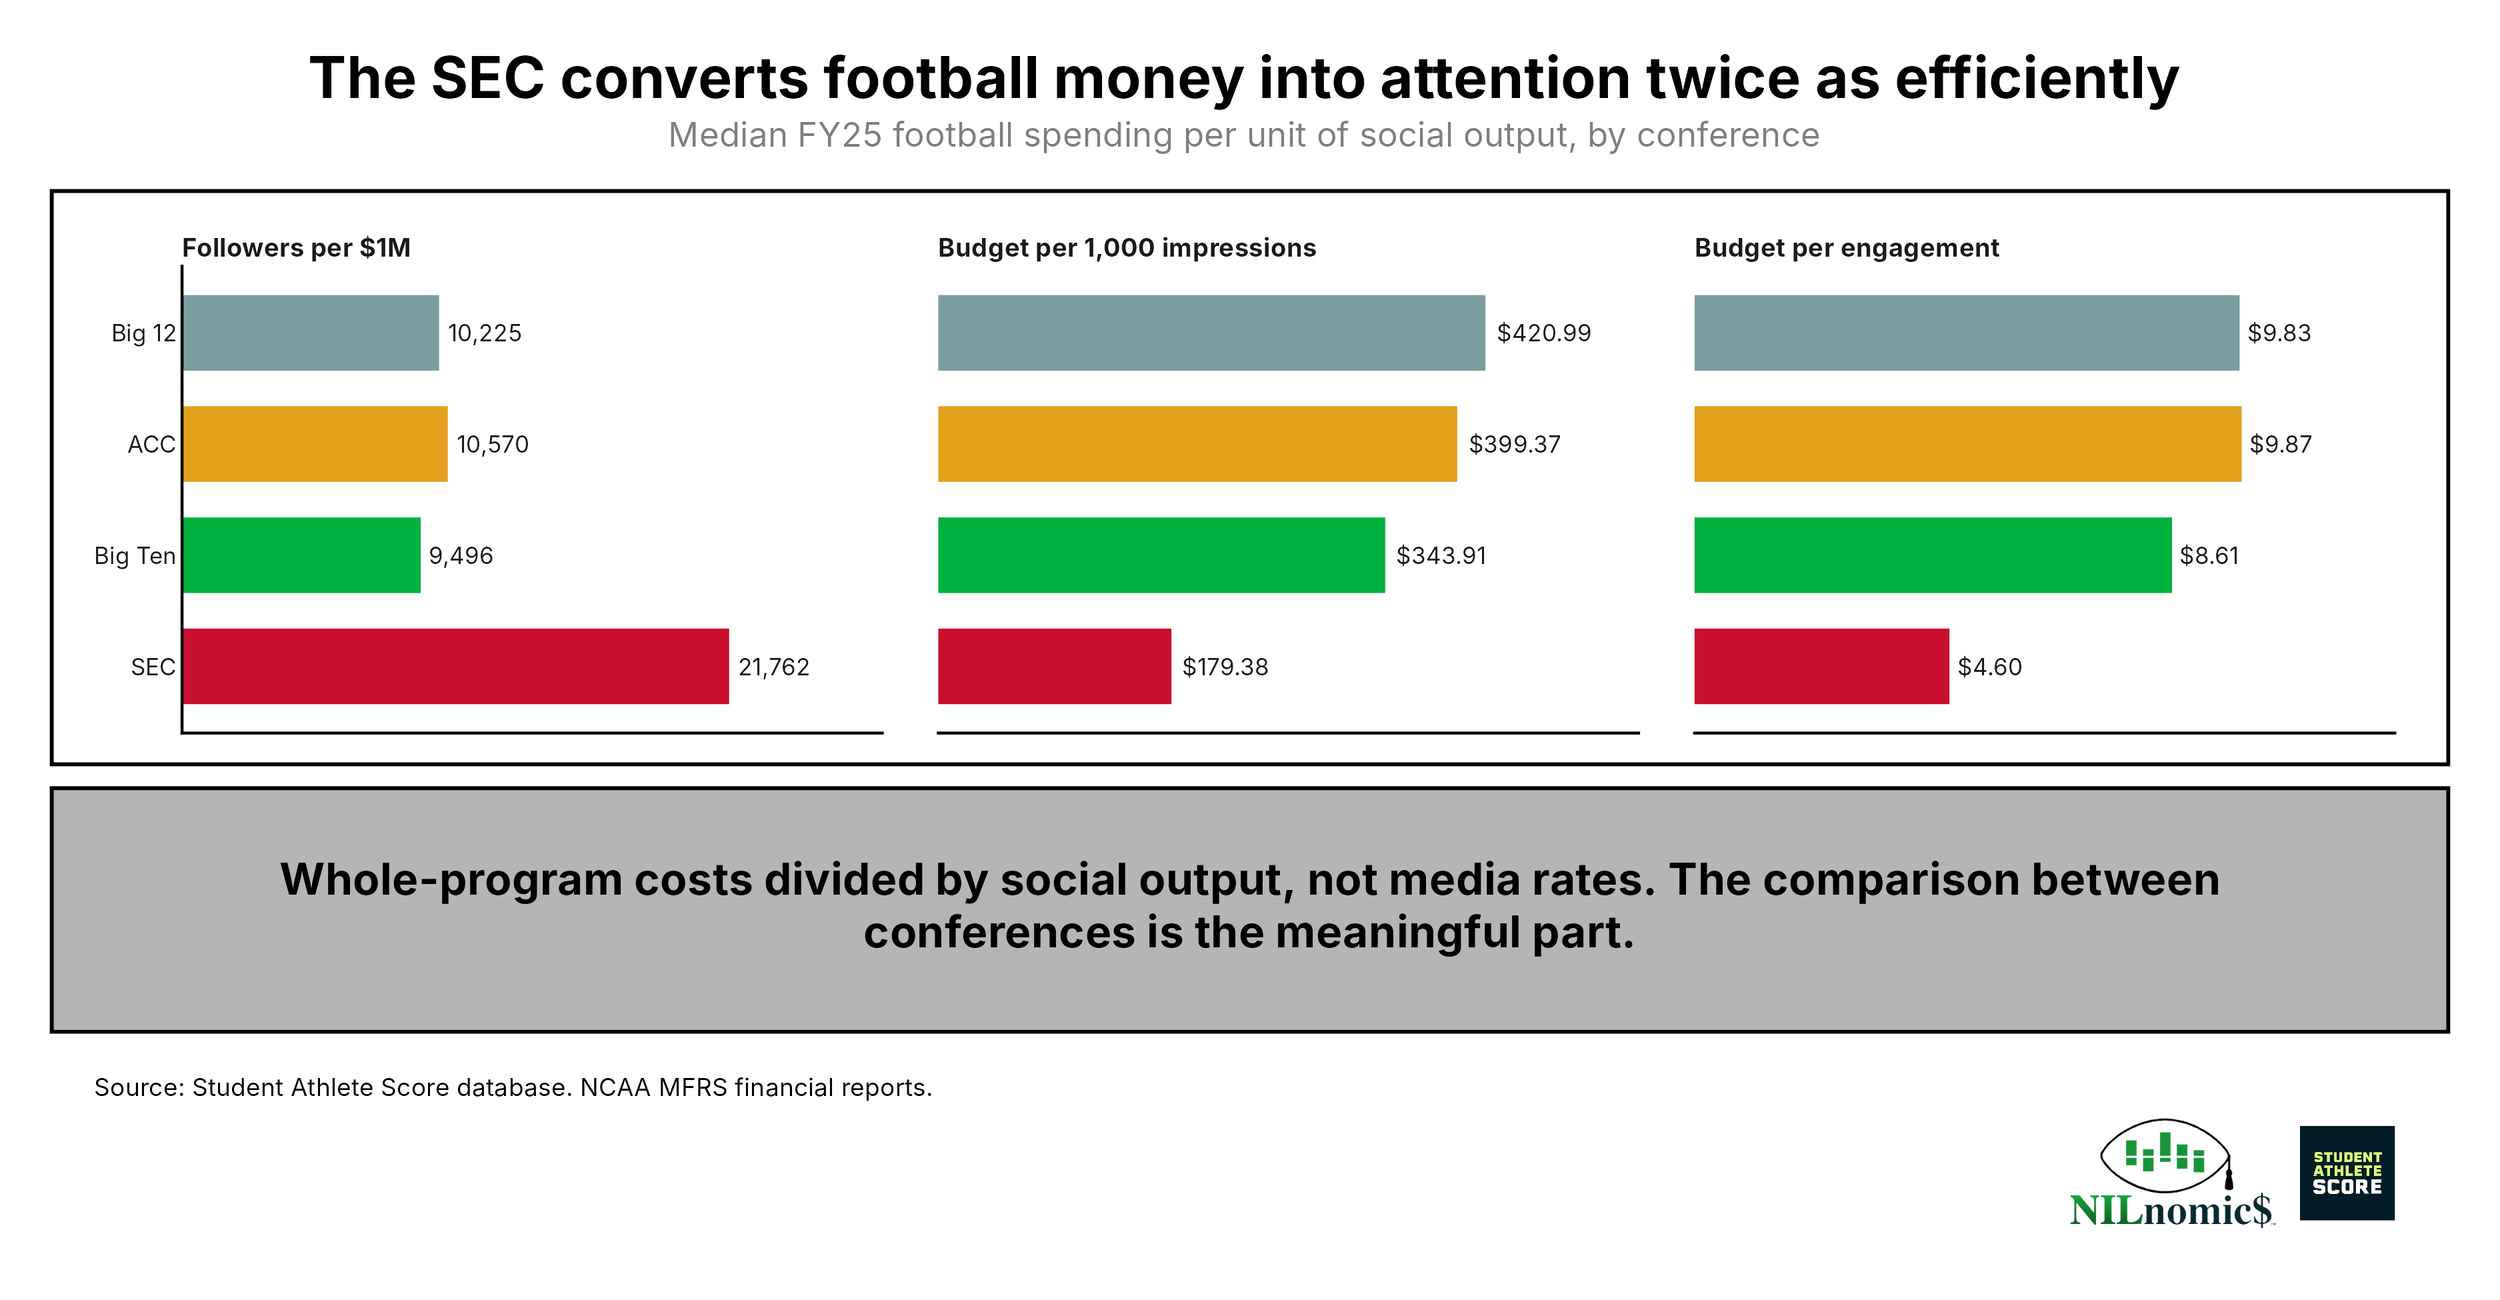
The median SEC program returns 21,762 followers per football dollar against 10,348 for the rest of P4, and spends $179 per thousand impressions against $344 to $421 elsewhere. Adding conference indicators to the spending regression, with the ACC as reference, the SEC coefficient is 0.60 (p = 0.016) while the Big Ten and Big 12 coefficients are indistinguishable from zero. The conference terms are jointly significant (F = 5.03, p = 0.005) and lift the R² from 0.49 to 0.62.
Holding football spending constant, an SEC program carries roughly 82 percent more football following than an equivalently funded ACC, Big Ten, or Big 12 program. That premium is not purchasable. It reflects conference brand, television inventory, and regional football culture accumulated over decades. For an athletic director outside the SEC, the practical implication is that the relevant benchmark is conference peers, because a large part of the gap to an equivalently funded SEC program is structural.
Money buys the stock, not the flow
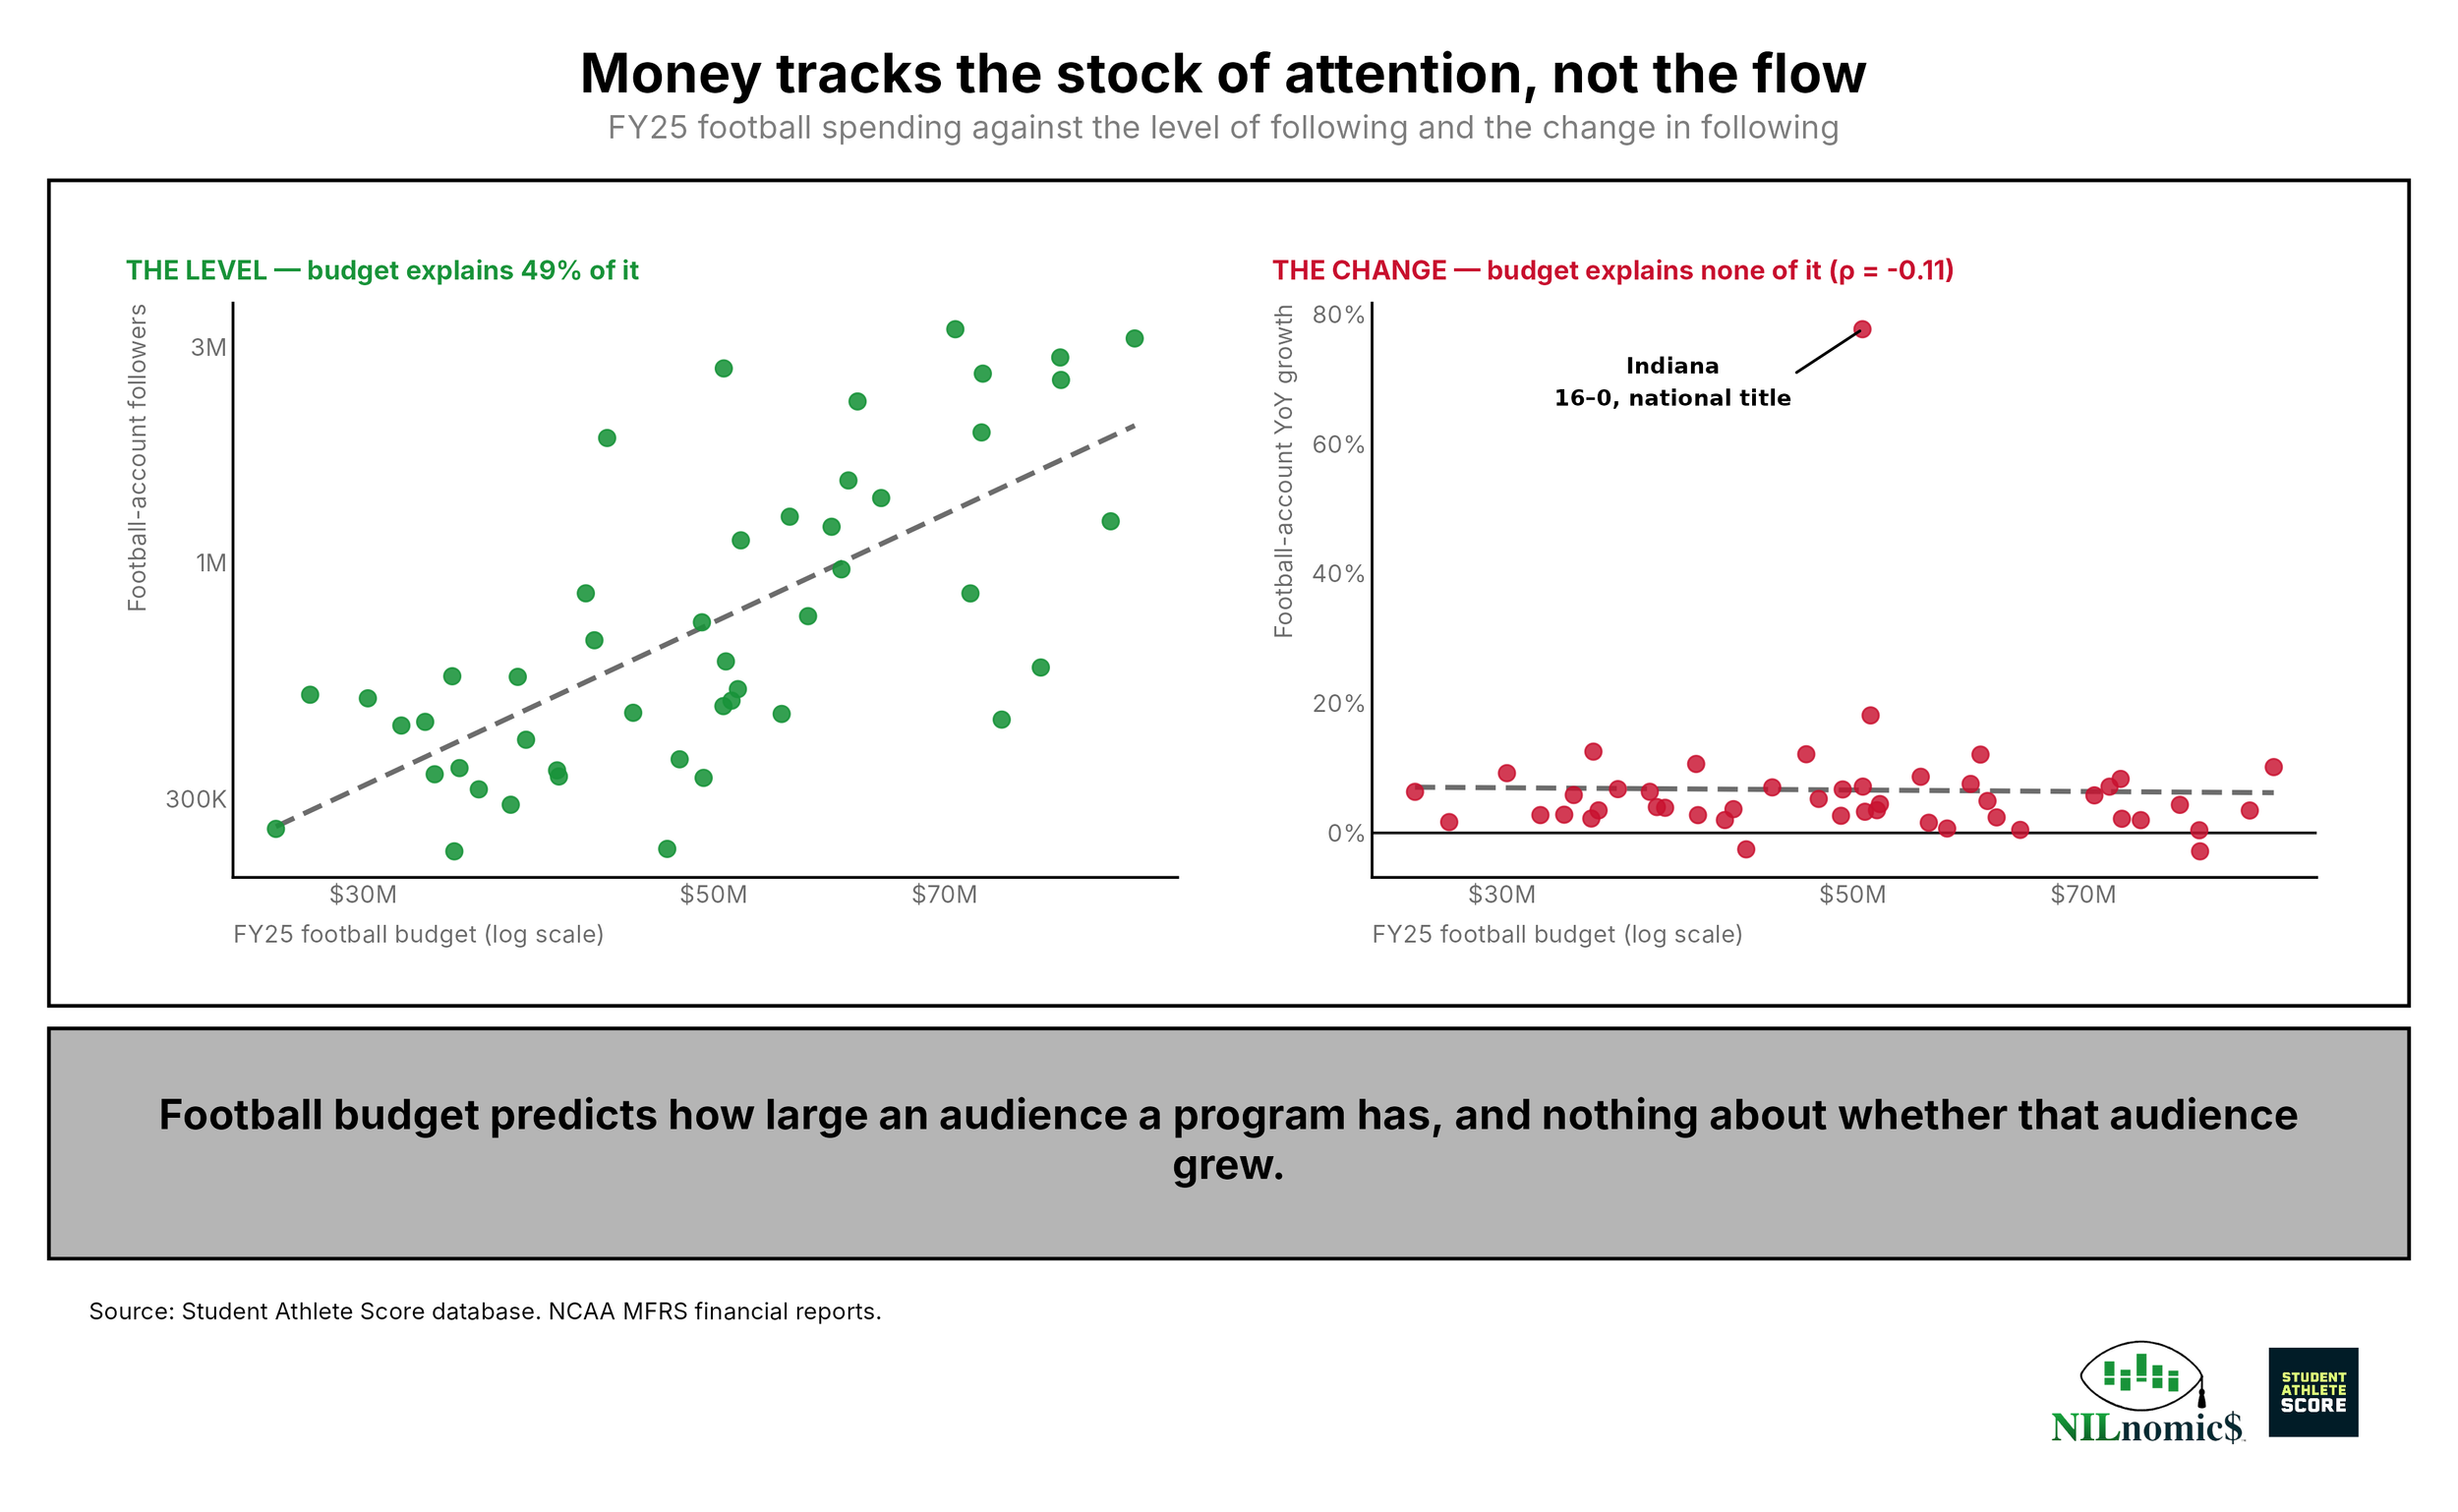
FY2025 football spending is meaningfully related to the size of a program's audience a year later. It has no relationship to whether that audience grew: the rank correlation between football budget and year-over-year follower growth is −0.11, with a p-value of 0.46, and an OLS fit returns an R² of 0.0004. The same holds at the department level.
Indiana demonstrates it from both directions. Its football program spent $50.7 million, marginally below the median, and carries about two-thirds of the following its budget predicts — a below-the-line program on the level. It also added more followers than every program in the sample except Ohio State, on the back of a 16–0 championship season. Colorado demonstrates the reverse: 3.3 times the football following its $42.8 million budget predicts, one of the largest positive residuals in the sample, and an account that nonetheless lost followers this year.
A large audience is substantially a function of budget, conference, and history — largely inherited and slow to move. Growth is a function of what happened last season.
5) The allocation question
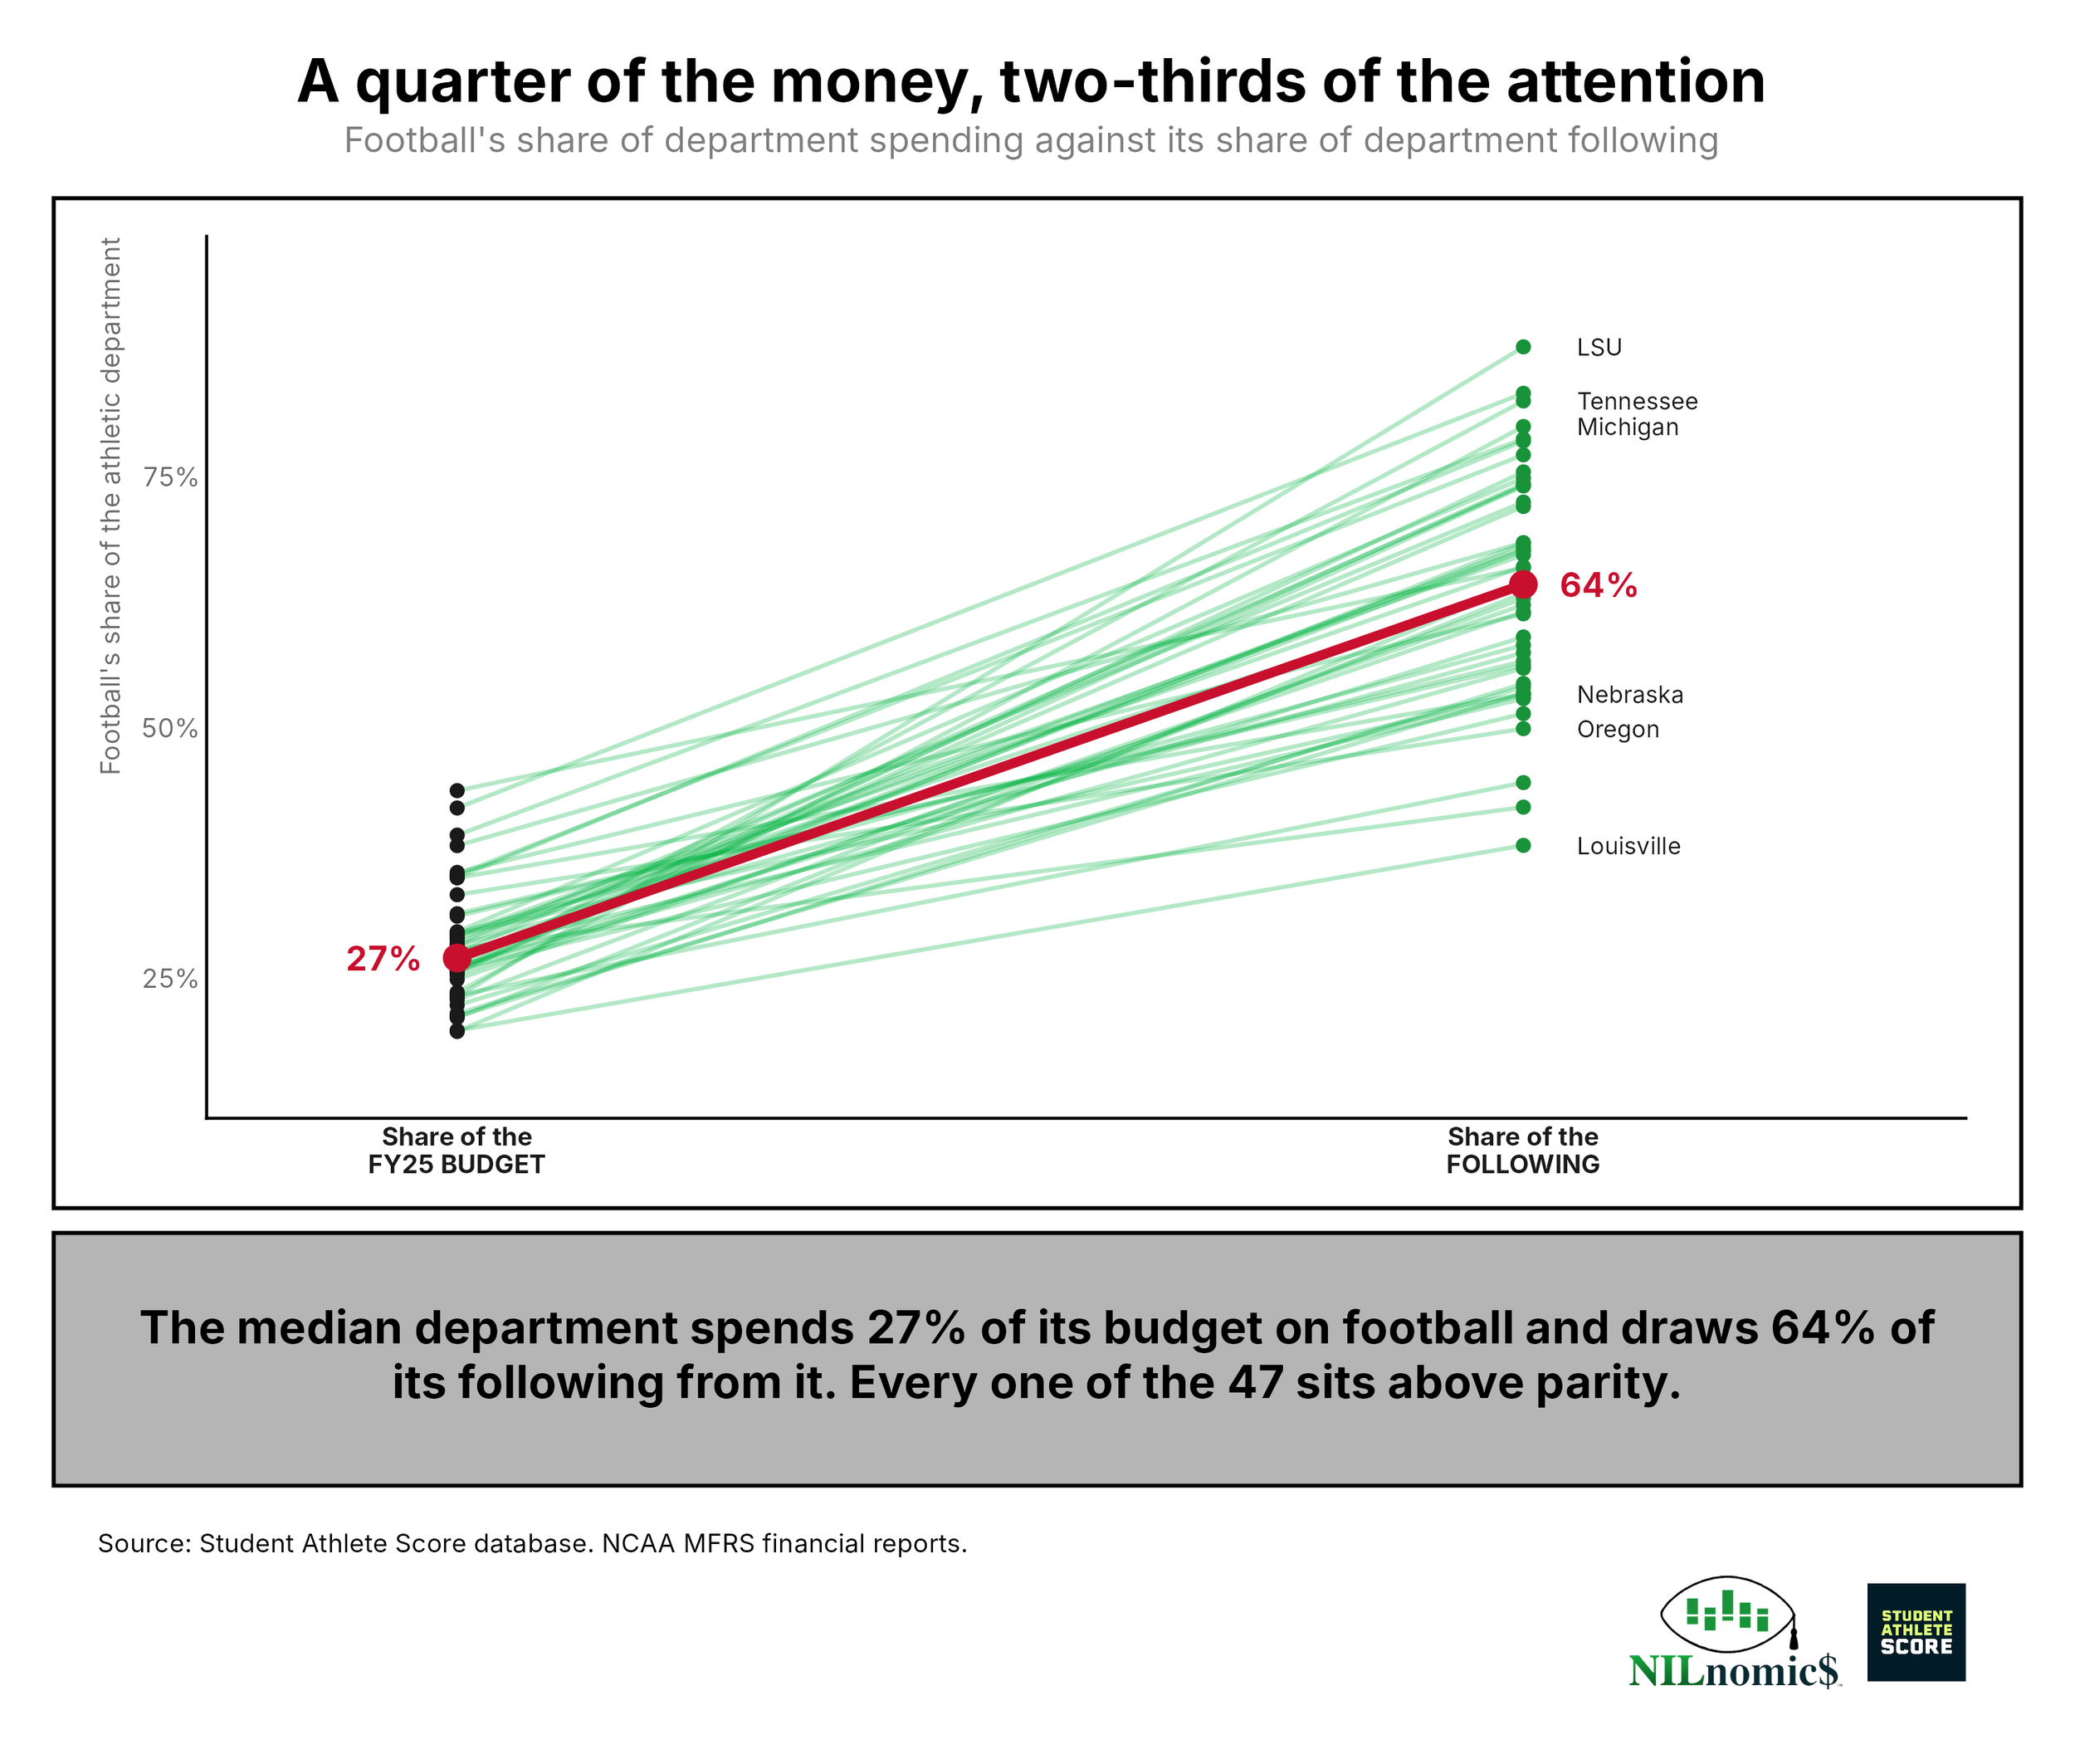
The median P4 department directs 27.0 percent of its spending to football and receives 64.3 percent of its social following from it — a gap of 37.3 percentage points. Every one of the 47 schools sits above the parity line, from Arizona's 14-point gap to LSU's 65-point gap. Not one department draws a smaller share of its audience from football than the share of its budget football consumes.
The most useful result here is a weak one. The correlation between football's share of the budget and football's share of the following is 0.26, with a p-value of 0.08 — suggestive at best, and not significant at conventional thresholds. How a department divides its money tells you very little about where its audience comes from.
Washington and Clemson allocate 43.7 and 42.0 percent of their budgets to football, the two highest shares in the sample. Louisville allocates 19.8 percent and has one of only five football accounts smaller than its department account. LSU allocates 23.1 percent — below the median — and draws 88.0 percent of its following from football, the highest concentration in the sample.
Two conclusions follow, and they point in different directions.
The first is that football is the most efficient audience-acquisition asset most departments own and the budget does not reflect that. If audience is a strategic objective — for ticketing, donor pipelines, or sponsorship inventory — the current allocation understates football's contribution to it.
The second is that the concentration is a risk the budget does not price. Two-thirds of the median department's public attention rests on the results of one team in one season, and the two clearest declines in this dataset were produced by seasons no administrator chose. The general athletics account is smaller, but it draws 25 percent more engagement per follower, it outgrew football on both expanding platforms, and its performance does not swing on a twelve-game schedule.
These are different assets with different risk profiles.
These are different assets with different risk profiles. The football account is a high-variance instrument tied to on-field results. The department account is a lower-yield, lower-variance one tied to institutional identity. A department can reasonably lean into either. What the data does not support is the current default, which is to fund football as though it were a quarter of the enterprise and to rely on it as though it were two-thirds.
Where this leaves an athletic department
Three findings survive the whole analysis. Football and the department account are not two versions of the same asset — football wins reach and loses response, and each is measured badly by the other's yardstick. The growth story that looks like a competence gap is a portfolio position: main accounts hold more of their audience on the one platform that is shrinking, and on the two that are growing they outperform football outright. And the distribution of money bears almost no relationship to the distribution of attention, in either direction — a department's budget split predicts very little about where its audience comes from, and a larger budget predicts nothing at all about whether that audience will grow.
None of that argues for a particular allocation. It argues that most departments are holding a portfolio position they arrived at by accumulation rather than by decision, and that the position is measurable. Five things follow from the data that an administrator can act on without waiting for another budget cycle.
Measure the two accounts against different benchmarks: Football is an acquisition channel and should be judged on reach and net new audience. The department account reaches a smaller, more committed audience and returns 25 percent more engagement per follower; it should be judged on response and retention. A single follower-count scorecard rewards the wrong behavior on both.
Run the X exposure calculation before commissioning a content audit: Forty-two of the 65 department accounts hold more than half their audience on X. Those accounts grew 2.2 percent over the year; the rest grew 6.6 percent. It is a one-line calculation and it will explain more about a flat year than any review of creative will.
Close the platform gaps first, because they are the cheapest fix available: Only 23 of 65 department accounts maintain a presence on all three platforms, and 31 carry both a majority-X audience and no tracked TikTok presence at all. Absence from a channel growing near 10 percent a year compounds, and no amount of production quality on the platforms a department already occupies will substitute for it.
Retire posting volume as a performance metric: Output varies nearly twelvefold across department accounts and correlates with growth at 0.04 — which is to say, not at all. Reach beyond the existing audience correlates at 0.60. Measuring impressions per follower instead of posts per month changes what a social staff optimizes for.
Benchmark against conference peers rather than the national field: At equal football spending an SEC program carries roughly 82 percent more following than an ACC, Big Ten, or Big 12 program. That premium reflects conference brand, television inventory, and decades of regional football culture. It is not available for purchase, and treating it as a performance gap will produce the wrong diagnosis and the wrong spending response.
The larger point sits underneath all five. Two-thirds of the median department's public attention rests on the outcome of one team's twelve-game season, and the two clearest declines in this dataset — Clemson and Colorado — came from seasons no administrator selected. That is a real concentration of risk, carried by nearly every department in the Power 4, and almost none of them appear to have priced it. Whether to lean further into football's reach or to build a second, steadier channel is a genuine strategic choice. The finding here is simply that most departments have not yet recognized they are making one.
A Rare Free NILnomics Release
This is the kind of work Greg Chick publishes inside NILNewsstand Pro.
Most of Greg’s original research and data-driven analysis is published exclusively for NILNewsstand Pro members. We’re making Two Front Doors freely available so the broader college athletics industry can see and discuss the findings.
If you want access to Greg’s next analysis — along with NILNewsstand’s member-only research, data, discussions, trackers, and resources — you’ll want to be a NILNewsstand Pro member.
Join NILNewsstand Pro →